Strategy: Visualize and Form Mental Images
This is a great strategy for older kids - upper elementary (3rd, 4th and 5th graders). If your child is having difficulty forming the mental image - prompt him with the following guiding questions/commands:
1. What does the character look like?
2. Imagine that this story is a movie - what does it look like to you?
3. Describe the setting - where the story takes place.
4. Make a sketch on scrap paper of the characters and settings of the story.
Another way to help a child who learns visually is to use graphic organizers. Graphic organizers are pictures which allow you to organize in writing the information from the text. Some are very simplistic and others are more complex, increasing in complexity with the information in the stories as well as the age group using them. It is very easy to create your own organizers, but it is even easier to type what you're looking for into a search engine. The problem becomes knowing which was is the best one.
Some common graphic organizers include story maps, Venn Diagrams, sequence charts, compare/contrast and description charts. Below, I have included samples of each of these. They are easy to create if you're not able to print them.
Try some of them and report back how they worked or if you have questions!
 |
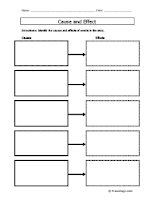
| This is an example of a cause and effect chart. It is mainly used to identify the problems of a story and the effects of those problems. |
 |
| This is an example of a sequence chart. Use these when your child is having difficulty remembering the events of a story in order. |
 |
| A story map is used to organize the literary elements of a work of fiction. This really shouldn't be used for non-fiction unless it reads like a novel. |


No comments:
Post a Comment